
This project was completed as part of the Accenture job simulation on The Forage platform. A fictional social media platform sought assistance in gaining insights from their content data. The provided dataset included details such as content categories, content types, and user sentiments. I conducted the analysis using Python, along with libraries like Pandas, Seaborn, and Matplotlib.
Key insights derived from the data include:
- The Travel category accounted for the highest number of content overall.
- Sentiment analysis revealed that the Healthy Cooking category received the highest positive sentiment scores, indicating strong potential for further growth in this area.
- Photos emerged as the most prevalent content type across all metrics, including content count, reaction count, and sentiment scores, followed by videos.
- The months of June and July recorded the highest levels of content creation and user reactions. Other months exhibited significantly lower activity, suggesting possible periods of non-operation for the platform.
- Friday experienced the highest content creation and reaction activity, while Wednesday recorded the lowest levels.
Visualizations from the analysis are provided below. The code for this project is available here.
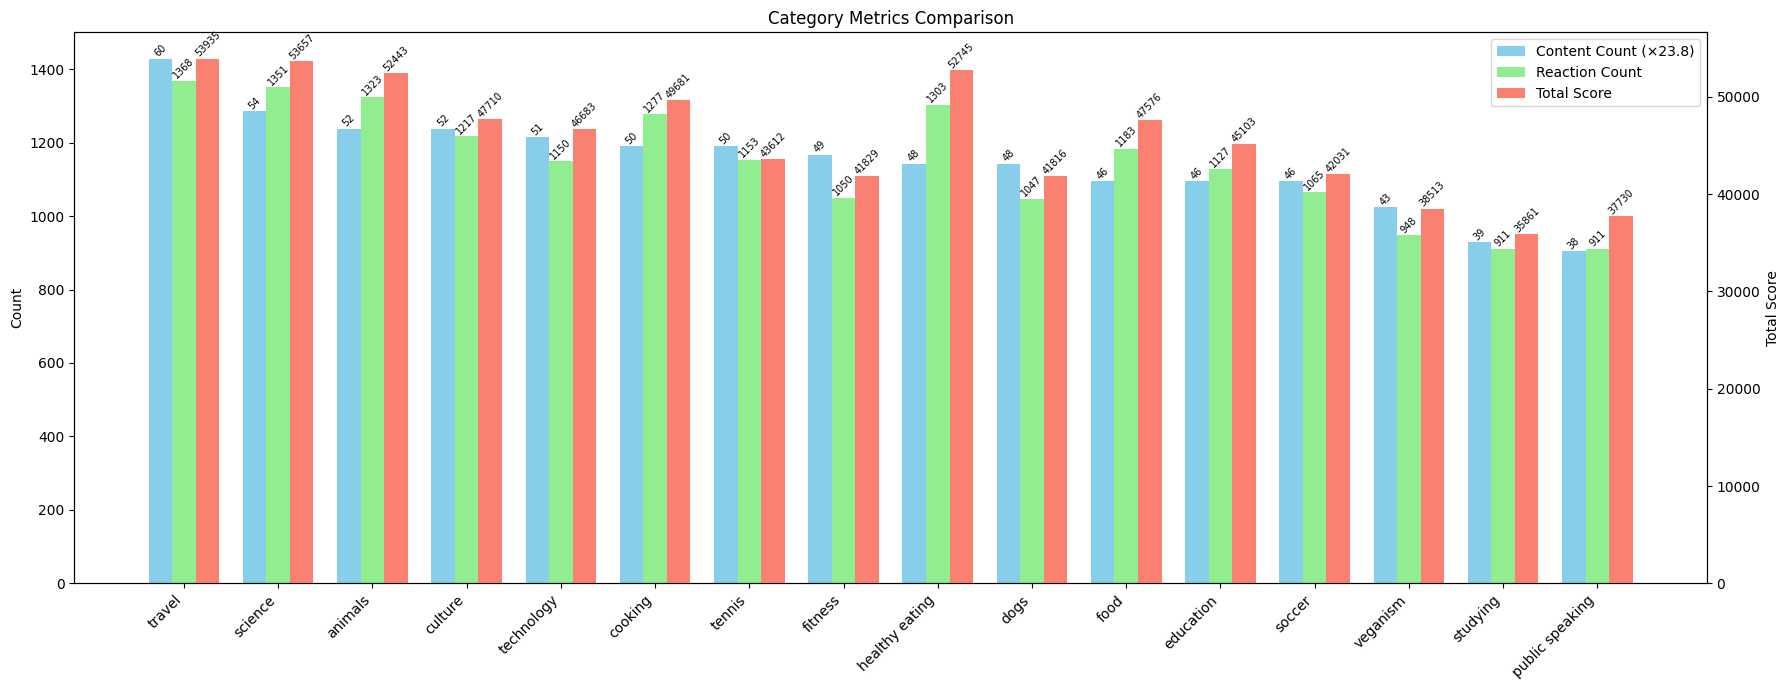
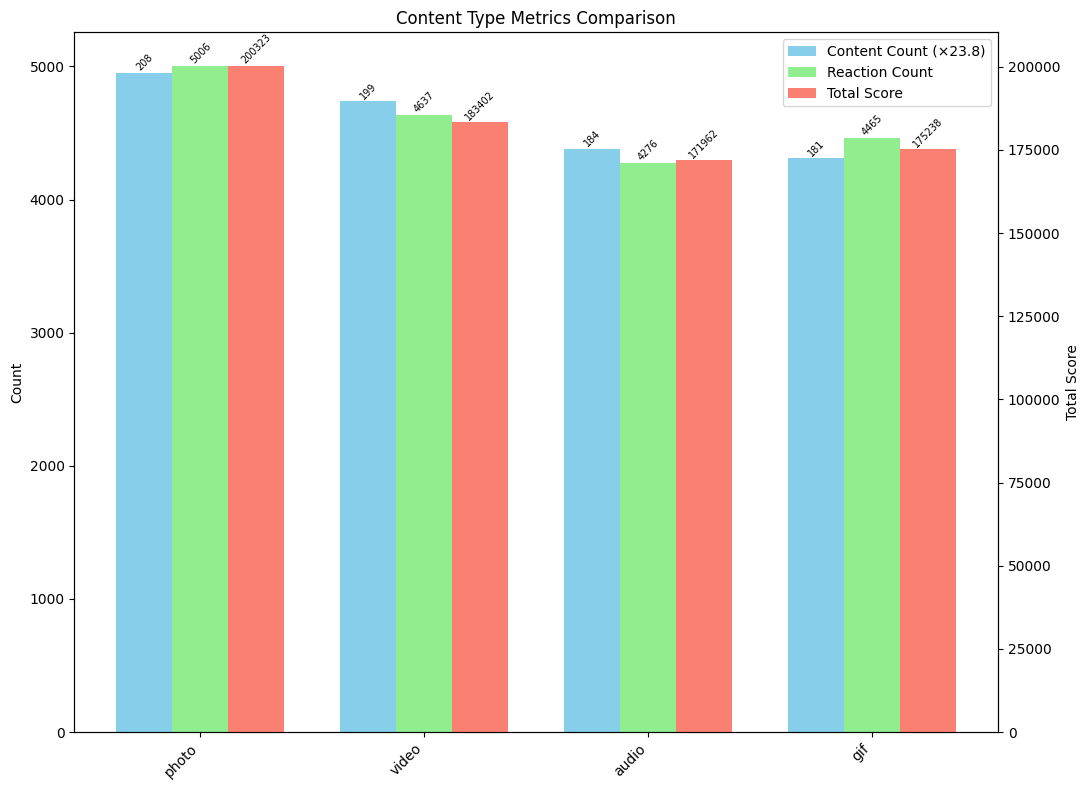
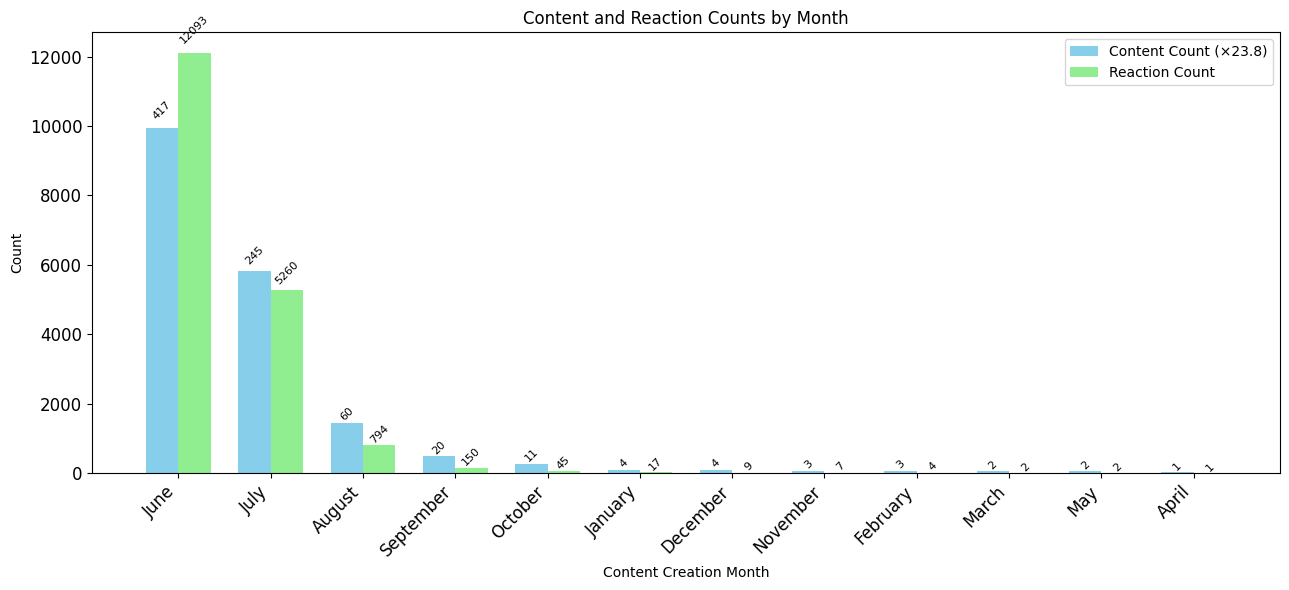
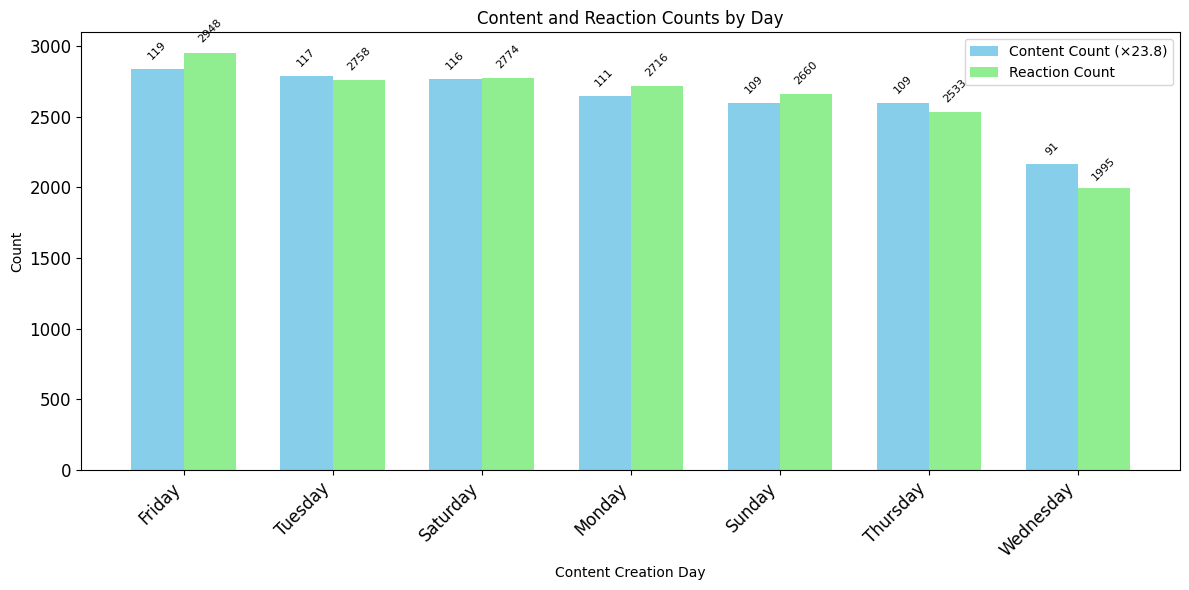
Photo by mikoto.raw Photographer