
As part of the PwC job simulation on The Forage platform, a hypothetical telecommunications company approached us seeking insights to address gender imbalance within their workforce. They provided a dataset containing employee demographics, job levels, performance ratings, tenure, and promotions, among others. Using Power BI, I visualized and analyzed the dataset, uncovering the following key insights:
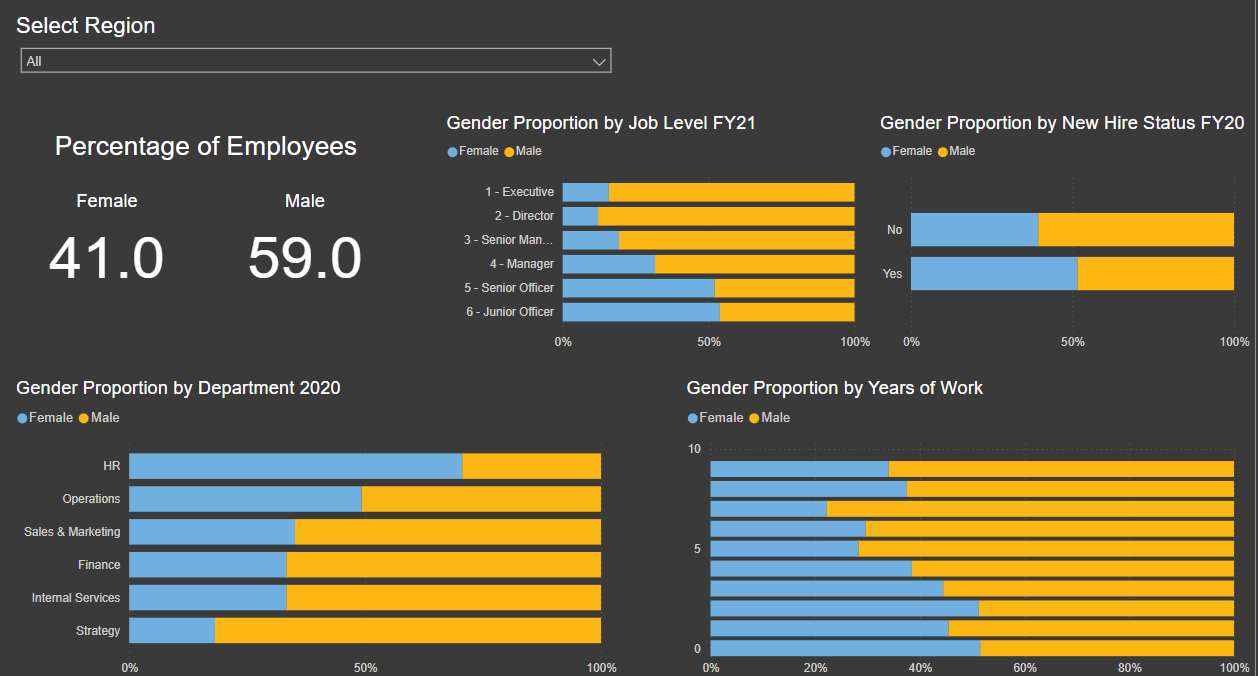
- The workforce shows a notable imbalance, with 41% female employees and 59% male employees.
- The gender gap widens significantly at senior job levels, such as Manager, Senior Manager, Director, and Executive roles, where male employees dominate.
- The Strategy department exhibits the most pronounced gender disparity, with women making up only 18% of its workforce.
- Conversely, the HR department has the highest proportion of female employees, representing 70% of its staff.
- The gender gap becomes more evident with longer tenures. Among employees with four or more years of service, male employees account for 60% or more of the workforce.
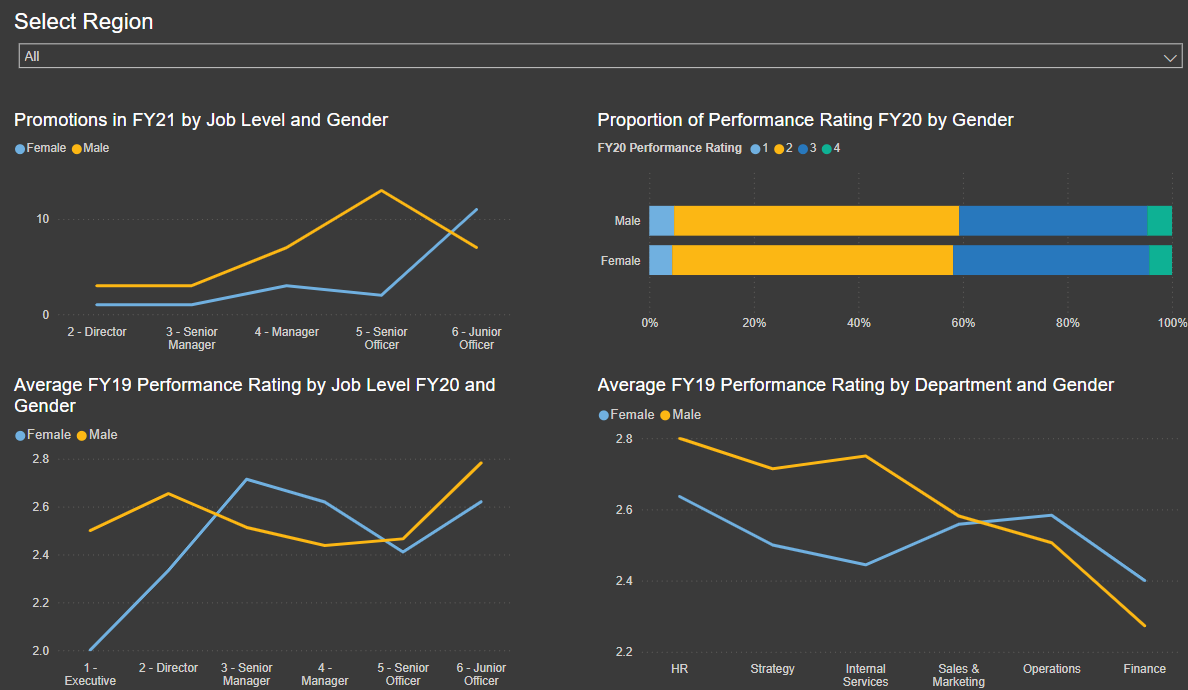
- Male employees received the majority of promotions across all job levels except for Junior Officer.
- Despite women achieving higher average performance ratings at levels such as Manager and Senior Manager, they were underrepresented in promotions.
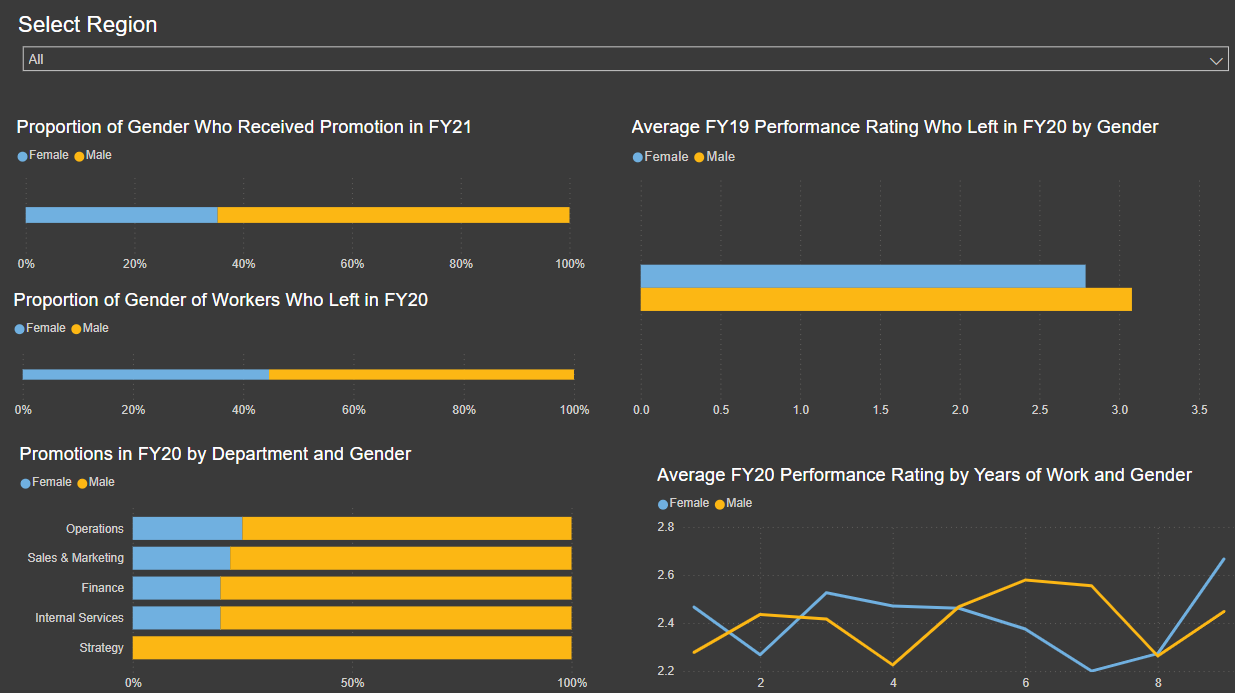
- In Fiscal Year 21, 64% of promotions were awarded to male employees, while in Fiscal Year 20, male employees received 75% or more of the promotions in every department.
- In Fiscal Year 19, male employees outperformed female employees in performance ratings in the HR, Strategy, and Internal Services departments.
- However, both genders recorded lower performance ratings in Finance, Sales & Marketing, and Operations.
- In Fiscal Year 20, 55% of employees who exited the organization were male. Among those who left, male employees demonstrated slightly higher performance ratings than their female counterparts.
Screenshots of the data visualization are shown below. The Power BI file for this project can be accessed here, and the badge of completion is available here.
Cover photo by fauxels